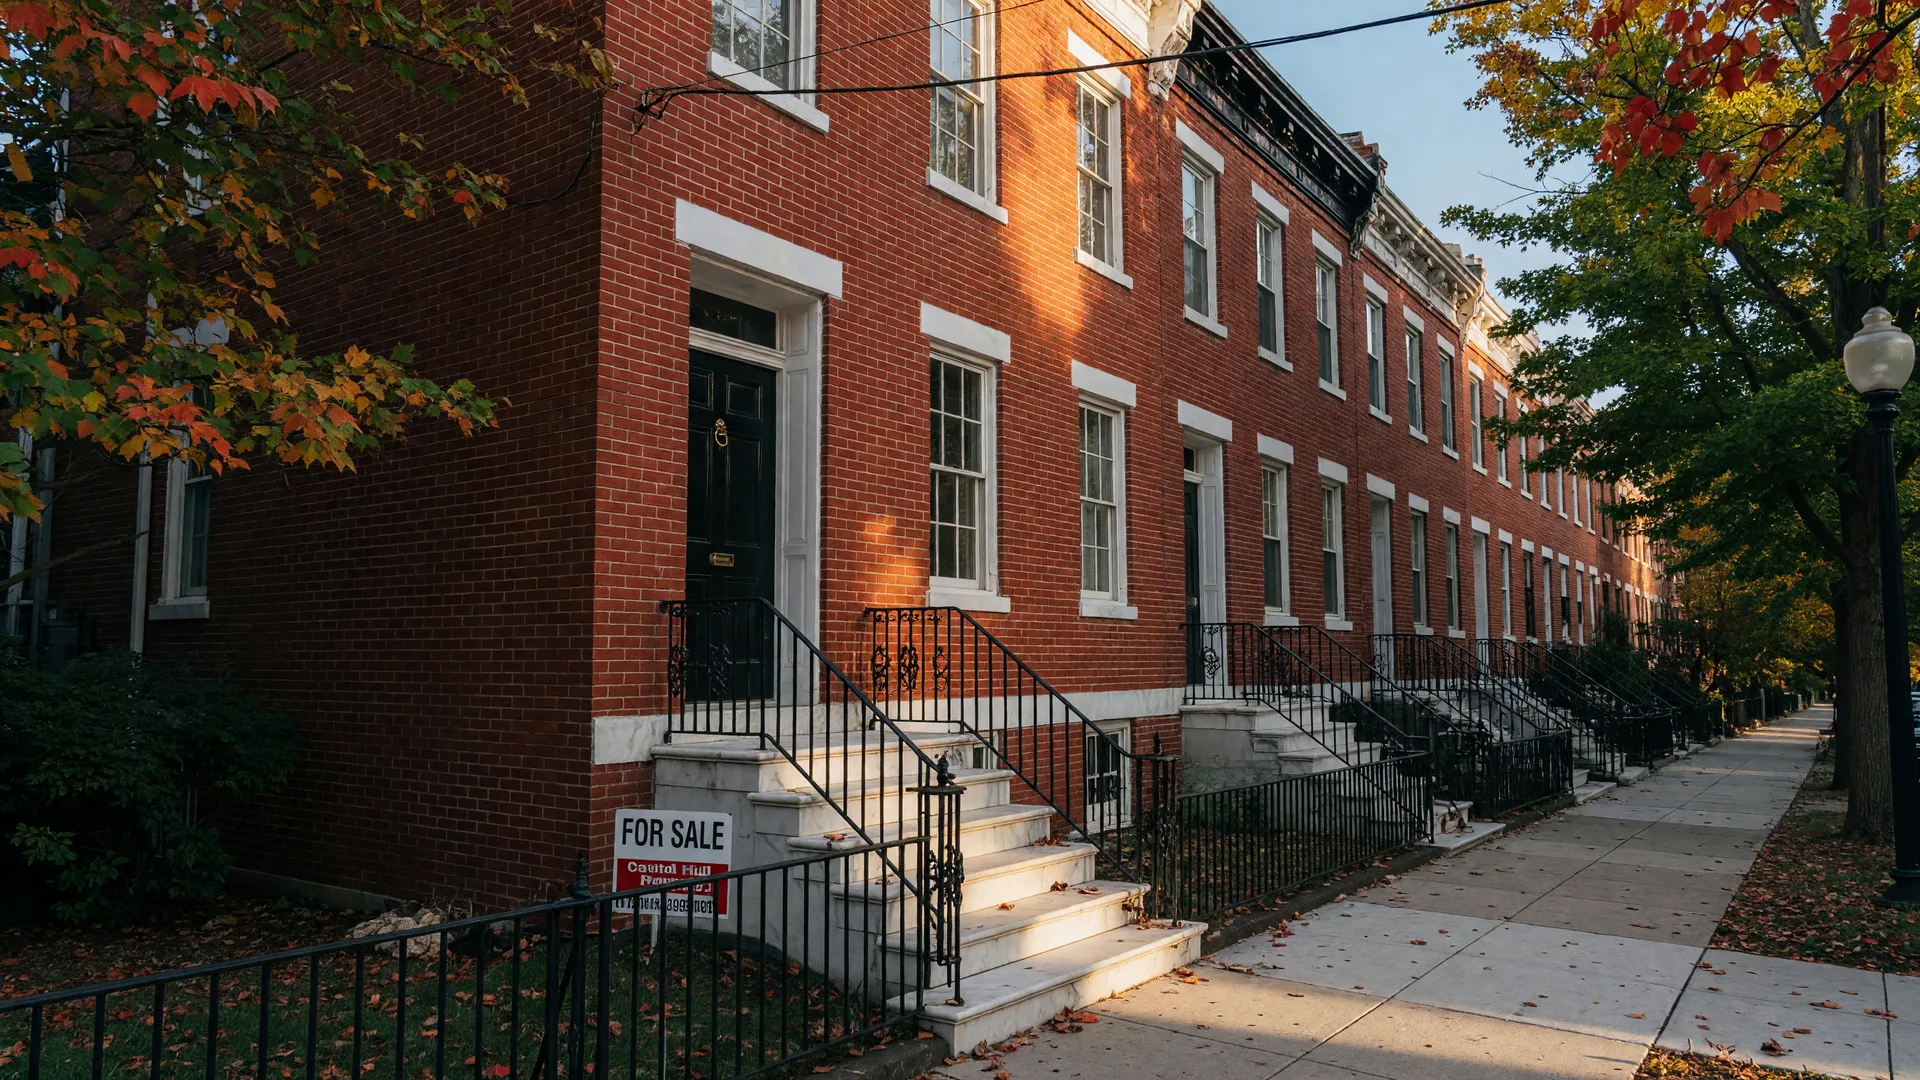
Key Takeaways
- Asking price and list price are the same number: the price a seller advertises in the MLS. The gap that matters is between that number and the final sale price.
- The typical DC home closes at 98.1% of its list price (Redfin, August 2026), about 1.9% below asking, with Northwest DC near 2% below and strong rowhouse blocks still at or above list.
- Inventory of 11,431 active listings in July 2026 (Bright MLS), a seven-year high for the month, means overpriced listings sit while priced-right homes sell; average days on market rose from 26 to 31.
- The sale-to-list ratio varies by pocket: Georgetown, Dupont Circle, and Capitol Hill rowhouses hold at or near list, while Arlington, Alexandria, and Silver Spring condo corridors negotiate closer to a 2% discount.
Asking price and list price are two ways to say the same number: the price a seller sets and advertises. The gap that matters is between that number and the sale price, and in Washington DC right now the District's sale-to-list ratio sits at 98.1%, so the typical home closes about 1.9% below list (Redfin, August 2026). For sellers, the goal is not to argue about words, it is to pick a list price that buyers recognize as honest from day one.
This guide is for anyone selling in the DC Metro area, whether you are pricing a rowhouse in the Capitol Hill neighborhood, a colonial in Bethesda, or a condo in the Clarendon area of the city of Arlington. It covers what the terms really mean, the numbers behind a 2026 sale, and the neighborhood-level differences that decide whether a listing sells in a week or stretches toward two months. The short version of the comparative market analysis (CMA) story is this: a defensible list price starts with sales that already closed, not a number that feels good.
Asking price vs. list price: is there a difference?
For a home seller, no. Asking price and list price describe the same figure: the number you and your agent decide to advertise in the MLS, on the for-sale sign, and across every listing portal. It is the opening position in the negotiation. It is not an appraisal, not a promise of value, and not a number a buyer is bound to meet.
The confusion comes from the word asking. People assume the asking price is a first bid the seller expects to come down from, and in a balanced market that assumption can be exactly backwards. Most list prices are set near what comparable sales support, and buyers negotiate from there in either direction. The label matters less than the strategy behind it: a number anchored to real market evidence, presented cleanly, with a marketing plan that earns the showings. What you call it never changes what it is, a market number the next buyer will test.
The number that matters: the sale-to-list ratio
Real estate professionals measure the spread between list and sale with one figure called the sale-to-list ratio. Divide the sale price by the list price and multiply by 100. A ratio of 100 means the home sold for exactly its list price. Above 100, buyers paid more than asking; below 100, they paid less. It is the cleanest single answer to "how close to asking do homes actually sell for here?"
In August 2026, Redfin's District of Columbia data put the sale-to-list ratio at 98.1%, up 0.3 points from a year earlier. That means the typical DC home sold for roughly 1.9% below its list price. The same page rates the market somewhat competitive, with about two offers per home, a median sale price near $684,000, and roughly 57 days on market. Across the metro, the median sold price was $650,000 in July 2026, up 1.6% year over year (Bright MLS).
The same ratio looks different across DC
The city-wide average hides real variation. Northwest DC averages about 2% below list, while Northeast DC sits near 1% below. Downtown Washington has run as low as 95%, a reminder that condo-heavy corridors negotiate harder than rowhouse blocks. Hot pockets still break the pattern: a well-priced home in the most sought-after parts of Capitol Hill or Georgetown can fetch at or slightly above list. And this is not a sudden shift: by late 2025, roughly 45% of DMV homes were already selling below their list price, so today's under-list sales are a continuation, not a shock.
Why the gap between asking and sale has widened in 2026
It comes down to supply. Values are not collapsing: the DC Metro median held at $650,000 in July, up 1.6% year over year (Bright MLS). But active inventory reached 11,431 listings in July, the highest count for that month in seven years, and average days on market climbed from 26 to 31. Buyers now compare several homes before they decide, and a hopeful list price gets measured against a full shelf of options instead of an empty one.
Mortgage rates keep buyer behavior cautious. The 30-year fixed average stood at 6.71% in early September (Freddie Mac), which puts affordability at the center of every budget conversation. When rates are high and choices are wide, the seller who lists at the top of hope waits, and the seller who prices against comparable sales moves. The first week usually decides which one you are, which is why what days on market really tells you before you list is worth reading before the sign goes up.
What a realistic list price looks like, neighborhood by neighborhood
The DC area is not one market, and the spread between list and sale plays out block by block. The neighborhood guides on this site go deeper on each place, but here is the pricing read from the current data.
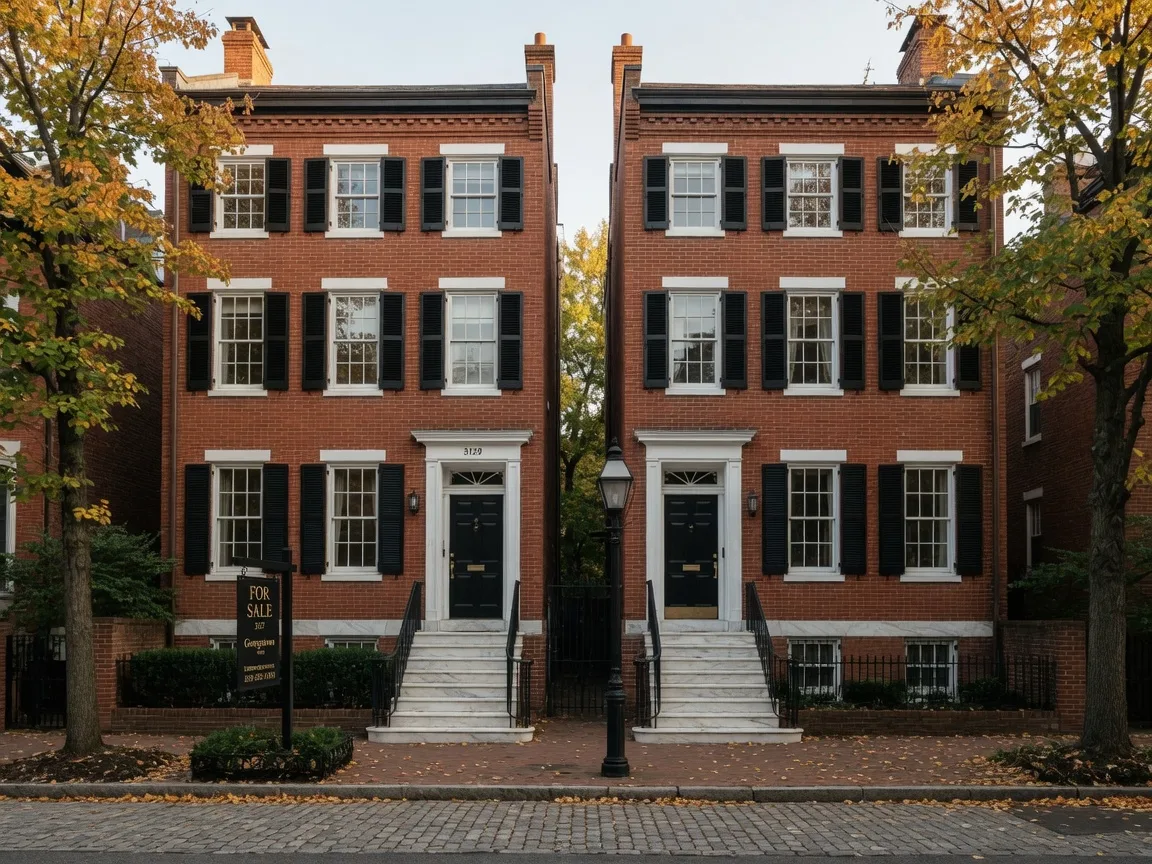
Capitol Hill and the rowhouse corridors
In the Capitol Hill neighborhood, a well-priced rowhouse still draws attention in its first week, and the sale-to-list ratio holds near 99% on Eastern Market blocks in the 20003 zip code. The condo side is softer: more units competing, buyers negotiating closer to a 2% discount. Sellers here lose the most leverage when they let the fastest comps set the tone for the block, so condition and price need to enter the market at the same time.
Georgetown and Dupont Circle
Georgetown (20007) and Dupont Circle (20036) hold some of the tightest supply in the metro, near 2.1 months, and detached homes and classic rowhouses can still draw at-or-above-list offers when priced correctly. The buyers there are discriminating, so the list price has to reflect true condition: a renovated, well-staged home commands the top of the range, while an as-is listing settles below it.
The Virginia side: Clarendon, Ballston, and Fairfax County
The city of Arlington keeps leading regional price growth, up about 6.4% year over year, with urban villages like Clarendon, Ballston, and Rosslyn anchoring the metro-condo market. But the wider Virginia numbers cooled in July: the median across the NVAR market areas fell 1.3% from a year earlier to $750,000 while active listings jumped 19.6%. In the Fairfax area the median sits near $812,000 with roughly 25 days on market (Redfin). The takeaway: sellers across the Virginia side now price against current competition, and buyers arrive with more options and negotiate closer to, or below, list.
Bethesda, Chevy Chase, and the Maryland side
Across the Potomac, Montgomery County is the region's strongest segment. The June median held at $680,000, up 5.4% year over year (GCAAR), with average days on market near 22. In Bethesda (20814) and Chevy Chase (20815), school-driven demand still produces near-list offers on family homes; it is the dated or overpriced listing that now waits. The county-by-county breakdown in the DMV market, county by county post explains where the three jurisdictions diverge.
What happens when the appraisal comes in below the contract price
This is the risk hiding inside a stretched list price. The buyer's lender funds against the appraised value, not the contract price, and appraisals pull from recent closed sales, the same comps that should have set the list price in the first place. When the appraisal lands below contract, the buyer can ask the seller to bridge the gap, renegotiate the price, or walk away entirely.
Sellers who priced from real comparable sales rarely face this conversation. Sellers who chased a hopeful number often do, and the correction tends to land on them. The earlier post on what an appraisal gap means for your sale walks through the options before you respond to that request.
How to set a list price that works, not one that just looks good
Start with current comparable sales: closed homes from the last three to six months, similar in type, size, condition, and location. Adjust for the differences buyers will actually notice, the renovation, the lot, the views, the parking, the walk to Metro. Then layer in the market's trajectory: is days on market rising or falling on your block, and is inventory in your zip code growing or shrinking? The Realtor.com Washington DC market page and the Redfin Washington DC market page are free starting points for the direction of travel, though neither replaces a proper CMA for a specific home.
Then choose the strategy. In a competitive corridor, a slightly disciplined list price can spark multiple offers and land at or above list; that is pricing for demand. In a balanced market, list where the comps say value sits, and let the marketing do the work. Either way, the number should survive scrutiny from the most experienced buyer's agent in the room. The selling guide takes the full process from comp to close, and the market report keeps the current numbers in one place.
The bottom line: list price is a strategy, not a guess
Asking price and list price are the same number, and in 2026 that number decides speed, leverage, and final dollars more than any other single factor. With the District closing at 98.1% of list price and more than 11,000 active listings across the metro, the seller who prices with data gets the showings, the offers, and the clean closing. The seller who prices on hope gets a lesson in days on market.
If you are planning a sale in Washington DC, Maryland, or Virginia, start with a conversation built on your home's actual comps rather than a template. Knowing whether your block is a 99% block or a 97% block is the difference between pricing to win and pricing to wait.
Frequently Asked Questions
Is asking price the same as list price?
Do DC homes sell below asking price in 2026?
How much below asking price should I offer in DC?
What is the sale-to-list ratio in Washington DC right now?
What happens if the appraisal comes in below the sale price?

Claude Labbe
Local market expert · REALTOR, Douglas Elliman · DC, MD, VA
703-868-7774 | Claude.Labbe@elliman.com
Want a straight read on what your Washington DC area home should list for this fall? Reach Claude Labbe at 703-868-7774 or visit the contact page to schedule a consultation. Talk soon.
Data Sources
Figures cited from Redfin's District of Columbia housing market page (sale-to-list ratio 98.1%, August 2026; median sale price near $684,000; roughly two offers per home; about 57 days on market), Redfin's Washington DC market page (Fairfax County median near $812,000 and about 25 days on market for the three months ending May 2026), Bright MLS (July 2026 DC Metro report: $650,000 median, 11,431 active listings, 31 average days on market), GCAAR (June 2026 Montgomery County median $680,000, +5.4%), and Freddie Mac's Primary Mortgage Market Survey of September 3, 2026 for the 30-year fixed rate. Market conditions change month to month; refresh against the newest release before planning a sale.